Sensu
Diagram
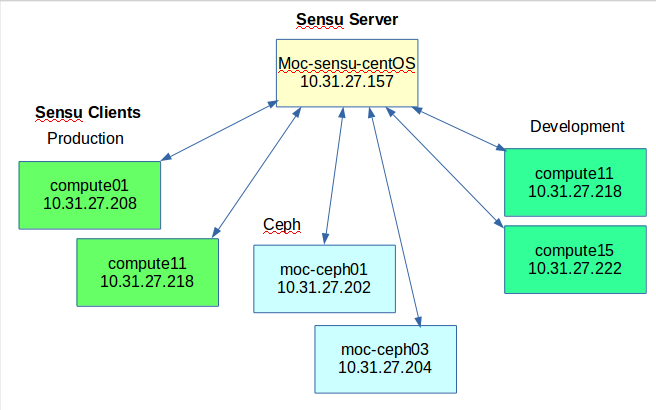
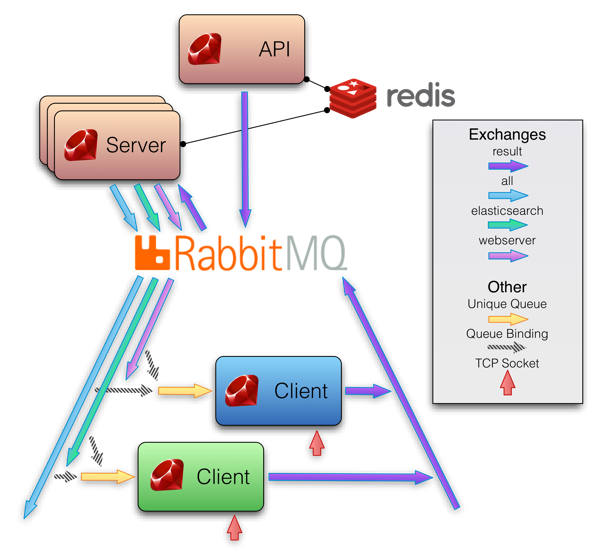
Sensu is composed of three Sensu parts. Sensu has a Sensu Server that distributes commands, Sensu Clients that receive those commands and send the results back to the Sensu Server, and Sensu API provides the REST-like interface for Sensu’s data.
Dependencies
Sensu Server relies on RabbitMQ for communicating with the Sensu clients, and it uses Redis for storing persistent data.
Sensu Client relies on RabbitMQ to communicate with the Sensu Server.
Sensu API depends on RabbitMQ and Redis.
Sensu Topology
Services
The server runs sensu-server and sensu-api while the clients only need to run sensu-client.
Sensu-server (we have Sensu server monitoring itself, so it treats itself as a client)
/etc/init.d/sensu-server restart
/etc/init.d/sensu-client restart
/etc/init.d/sensu-api restart
Sensu-client
/etc/init.d/sensu-client restart
Monitoring
There are two categories related to monitoring for Sensu. There are checks and handlers.
Checks are further divided into tests or metrics. For test checks, they are used to determine if a service like Apache is up or down. For metric checks, they are used to output collected data values like cpu utilization.
Checks
Checks are designed to return 5 different responses. If you write a script for Sensu to run, you need to exit with one of these response values.
STATE_OK=0
STATE_WARNING=1
STATE_CRITICAL=2
STATE_UNKNOWN=3
STATE_DEPENDENT=4
Subscriber and Subscription
We defined a check to run on nodes subscribed to the a channel (e.g. “moc-sensu”)
which is contained in the subscriber array in the check’s configuration.
Any client subscribed to this channel will execute this check.
The subscription which a client registers is defined in its /conf.d/client.json.
| heartbeat | moc-sensu | openstack-api | openstack-metrics | moc-impi | ceph | instructions-retired |
|---|---|---|---|---|---|---|
| ./sensu_server/check_heartbeat.json | ./hardware/check_memory.json | ./openstack/check_keystone-api.json | ./openstack/check_nova-hypervisor-metrics.json | ./check_sensor.json | ./openstack/check_ceph-osd_metrics.json | ./hardware/check_instructions_retired.json |
| - | ./hardware/check_disk-fail.json | ./openstack/check_neutron-api.json | ./openstack/check_nova-server-state-metrics.json | - | ./openstack/check_ceph.json | - |
| - | ./hardware/check_ip.json | - | ./openstack/check_neutron-agent-status.json | - | - | - |
| - | ./hardware/check_disk-usage_metrics.json | - | - | - | - | - |
| - | ./hardware/check_load_metrics.json | - | - | - | - | - |
| - | ./hardware/check_disk_metrics.json | - | - | - | - | - |
| - | ./hardware/check_cpu_metrics.json | - | - | - | - | - |
| - | ./hardware/check_cpu_pcnt_metrics.json | - | - | - | - | - |
| - | ./hardware/check_memory_metrics.json | - | - | - | - | - |
Configurations
All configuration files are inside /etc/sensu/
config.json (Sensu server and clients) Here on the Sensu server, you set the configurations for RabbitMQ, Redis, and Sensu API. RabbitMQ’s settings are directed to Sensu server’s user and password.
{
  "rabbitmq": {
    "host": "localhost",
    "vhost": "/sensu",
    "user": "sensu",
    "password": "secret"
  },
  "redis": {
    "host": "localhost"
  },
  "api": {
    "port": 4567
  }
}
The clients are directed toward the host’s IP, user, and password.
{
	"rabbitmq": {
	"port": 5672,
	"host": "10.31.27.157",
	"user": "sensu",
	"password": "secret",
	"vhost": "/sensu",
	"reconnect_on_error": "false"
  }
}
client.json (Sensu server and clients) On all the clients, you have a client.js distinguishing what IP and what subscriptions that the client is subscribed to. Subscriptions mean that this client will only perform checks with this subscription in its json file.
Clients have a name and their IP attached to the client.js. Each have a subscription list tying it to subscriptions that the checks are categorized in.
{
	"client": {
	"name": "compute01.moc.rc.fas.harvard.edu",
	"address": "10.31.27.208",
	"bind": "127.0.0.1",
	"subscriptions": [
		"moc-sensu"
	],
	"safe_mode": false,
  	"keepalive": {
	},
  	"port": "3030"
  }
}
plugins folder (Sensu server and clients) The plugins folder contains all of the scripts that run tests or metrics collection. Since we have the Sensu server treating itself as a client, it also has all of the monitoring checks.
handlers folder (Sensu server and clients) The handlers folder contains all of the handlers used to manipulate the results
of the checks received by the server. For example, we have a mailer.rb to be used to send e-mails to the kaizen@lists.massopen.cloud.
uchiwa.json (Sensu server only) We have a Uchiwa dashboard, which is a GUI for the Sensu monitoring checks.
You can visit it at http://10.31.27.157:3000. The username and password is in uchiwa.json.
sudo service uchiwa start
Example check: check_ip.json (Sensu server only)
There are four main parts of every check.
A check has handlers. Default is a simple pipe that takes input of check results and outputs into logs.
Email uses a handler_email.json, which uses mailx to send e-mails to the appropriate recipients.
A check has a command. It normally runs a script inside the plugins folder.
A check has an interval. How many seconds do you want the check until running again?
A check has a subscription name or you can call them categories. Inside the client.json, you subscribe the client to certain subscription names, and the client will only perform checks that have those subscription names in them.
{
  "checks": {
    "ip_check": {
      "handlers": ["default", "email"],
      "command": "/etc/sensu/plugins/check-ip-connectivity.sh",
      "interval": 10,
      "subscribers": [ "moc-sensu" ]
    }
  }
}
Example handler: handler_email.json (Sensu server only)
There are usually three main parts of every handler.
A handler can be triggered based on severity or exit status. You can list the triggers for the handler in a severity section.
A handler has a type. There are default types like pipe, which is exactly as it implies. It receives a pipe from the resulted output and sends that piped log to the email for the handler to take.
A handler has a command. It can trigger any bash or shell command,
but it also tends to be used to trigger handler scripts inside /etc/sensu/handlers.
{
  "handlers": {
    "email": {
      "severities": [
        "warning",
        "critical"
      ],
      "type": "pipe",
      "command": "mailx -s 'Sensu Alert' huyle333@bu.edu"
    }
  }
}
Logs
	/var/log/sensu/sensu-server.log
	/var/log/sensu/sensu-client.log
	/var/log/sensu/sensu-api.log
Details of MOC Sensu
Sensu-server
sensu 10.31.27.157
Sensu-clients
| Client Node | IP | Subscription |
|---|---|---|
| sensu | 10.31.27.157 | moc-sensu, heartbeat |
| logstash | 10.31.27.152 | N/A |
| controller | 10.31.27.207 | moc-sensu |
| compute01 | 10.31.27.208 | moc-sensu |
| compute02 | 10.31.27.209 | moc-sensu |
| compute03 | 10.31.27.210 | moc-sensu |
| compute04 | 10.31.27.211 | not connected |
| compute05 | 10.31.27.212 | moc-sensu |
| compute06 | 10.31.27.213 | moc-sensu |
| compute07 | 10.31.27.214 | moc-sensu |
| compute08 | 10.31.27.215 | moc-sensu |
| compute09 | 10.31.27.216 | moc-sensu |
| compute10 | 10.31.27.217 | not connected |
| compute11 | 10.31.27.218 | moc-sensu |
| compute12 | 10.31.27.219 | permission denied |
| compute13 | 10.31.27.220 | not connected |
| compute14 | 10.31.27.221 | not connected |
| compute15 | 10.31.27.222 | permission denied |
| eos-ctl01 | 10.31.27.11 | N/A |
| moc-sat | 10.31.27.201 | N/A |
| moc-calamari | 10.31.27.205 | N/A |
| moc-ceph01 | 10.31.27.202 | moc-sensu, ceph |
| moc-ceph02 | 10.31.27.203 | moc-sensu, ceph |
| moc-ceph03 | 10.31.27.204 | moc-sensu, ceph |
| moc-mon | 10.31.27.206 | not connected |
| moc-rgw | 10.31.27.223 | permission denied |
| compute-20.moc.ne.edu | 10.13.37.73 | moc-sensu |
| compute-21.moc.ne.edu | 10.13.37.75 | moc-sensu |
| compute-29.moc.ne.edu | 10.13.37.11 | moc-sensu |
| compute-30.moc.ne.edu | 10.13.37.13 | moc-sensu |
| compute-31.moc.ne.edu | 10.13.37.15 | moc-sensu |
| compute-34.moc.ne.edu | 10.13.37.37 | moc-sensu |
| compute-35.moc.ne.edu | 10.13.37.35 | moc-sensu |
| compute-37.moc.ne.edu | 10.13.37.33 | moc-sensu |
| compute-38.moc.ne.edu | 10.13.37.6 | moc-sensu |
| compute-40.moc.ne.edu | 10.13.37.28 | moc-sensu |
| compute-41.moc.ne.edu | 10.13.37.29 | moc-sensu |
| compute-42.moc.ne.edu | 10.13.37. 9 | moc-sensu |
| compute-43.moc.ne.edu | 10.13.37.23 | moc-sensu |
| compute-43.moc.ne.edu | 129.10.3.47 | moc-sensu, openstack-api, openstack-metrics |
See also Sensu & Filebeat for Ceph in Kaizen
OpenStack
To be able to talk to OpenStack api with specific client libraries on sensu server for testing checks, the specific client library should be installed.
Here are two example for installing python libraries of neutronclient and novaclient
sudo pip install rackspace-neutronclient
sudo pip install python-novaclient
Library and Tools
sensu-cli - sensu-cli allows interacting with sensu-api with command line.
Install sensu-cli ruby gem
gem install sensu-cli
There is one settings file for host, port, ssl, and HTTP timeout that lives in your
user directory ~/.sensu/settings.rb. You can alternatively place this in /etc/sensu/sensu-cli/settings.rb.
host  "127.0.0.1"
port  "4567"
ssl   false
read_timeout 20
open_timeout 20
sensu-plugin - Plugins and helper libraries for Sensu and it’s necessary to run some ruby checks, e.g load_metrics.ruby
gem install sensu-plugin
Sensu and Puppet
At this moment only installation of sensu clients is partly puppetized in MOC, which synchronizes compute nodes ranging from 1 to 11 using the sensu puppet module which is defined in sensu-puppet, an open source puppet module.
The way to install sensu-puppet is simply copy the module source files in below path on moc-sat node, which is currently the puppet master of MOC and then puppet will look up this module and install it automatically.
[root@moc-sat modules]# /etc/puppet/environments/production/modules
Sensu installation issues
Rabbitmq-server
- ERROR: distribution port 25672 in use on (by non-Erlang process?) And disable SELinux for the time being in /etc/selinux/config file
SELINUX=disabled
Sensu ipmi info
see bitwarden Sensu ipmi info